Infrared laser spectroscopy at your fingertips
Sensing applications take a big step forward, thanks to a photonic chip spectrometer that delivers the performance of a table-top laboratory instrument
BY Augustinas Vizbaras FROM Brolis Sensor Technology
Developed during the first half of the twentieth century, infrared spectroscopy has established itself as an effective, widely adopted laboratory technique for analysing organic and inorganic compounds. By measuring the interaction of matter with infrared radiation, this form of spectroscopy can identify compositions of substances, determine the presence and absence of chemical species, and offer quantitative and qualitative analysis. When radiation is directed at a substance, the photons that are absorbed have energies coinciding with vibrational frequencies that are molecule specific. Since every different molecule has a unique molecule-specific absorption spectrum, it is possible to identify species and measure their concentrations within a sample.

Figure 1. The basic principles of infrared spectroscopy, when measuring a sample in a transmission configuration. Orientations include: (a) a broadband light source and a static filter, (b) a broadband light source with a tuneable filter, and (c) a tuneable light source. BB short for the broadband light source, Sample is the object under investigation, Filter is the spectral filter/wavelength discriminator, and D is the detector of radiation.
The tremendous insight garnered from infrared spectroscopy has led to the use of spectrometers in numerous applications. This technique is serving in the biomedical sphere, where it is used to analyse biological fluid, tissue and pharmaceuticals; it is deployed in industrial sectors, such as those involving chemicals, bioreactors, petrochemicals and polymer technology; it is valued in environmental settings, providing the likes of gas analysis and pollution monitoring; it is found in the food industry, where it provides trace element detection and unveils composition; and it also serves in agriculture and veterinary applications.
So common is infrared spectroscopy that it is found in every governmental, regulatory or industrial laboratory, providing a gold standard. Note that instrumentation takes many forms, from the universal table-top Fourier-transform infrared spectrometer (FTIR), to different designs of laser spectrometer and Raman spectrometer.
Unfortunately, all these high-end tools are bulky and expensive, restricting their use to the lab. It would be far better to deploy them directly at sites, providing in-line, in-situ monitoring. However, this is too expensive, preventing the opportunity to provide better control over processing and the identification of deviations from intended processes in real-time. Instead, when infrared spectroscopy is used today, it provides results that are offline – and often off-site.

Table 1 (a). The light source, a laser, for a GaSb/silicon spectrometer-on-chip.

Table 1 (b). The detector technology for a GaSb/silicon spectrometer-on-chip.
Table 1 (c). The photonic integrated circuit technology for a GaSb/silicon spectrometer-on-chip.
Gathering results in real-time is hugely beneficial. As well as providing immediate feedback, it unveils dynamics – that is, trends over a given period of time. Rarely or never can a trend be deducted from a single data point.
Another attractive feature of spectroscopy is its generality. This technique is capable of identifying and quantifying many different molecules. While it’s crucial to adapt data algorithms for every molecule, from a hardware perspective the technology is the same and thus generic. Thanks to this, technology can be scaled, costs driven down and adoption increased. It is the choice of hardware that defines the cost, form-factor and performance. An additional decision facing the designers of spectrometers is the configuration that is used (several are shown in Figure 1).
One of the key differences between the various classes of infrared spectrometer is the technique employed for wavelength discrimination. This can be static, dynamic, or a combination of both. Which approach is taken has significant ramifications, impacting a number of system properties, including the spectral power density, the number of components, the power consumption and the footprint. The value for them may limit the level of miniaturization.
Typical state-of-the-art FTIR spectrometers command price tags between Ä20,000 and Ä70,000, have dimensions of around 1 m by 0.6 m by 0.2 m, and weigh about 30 kg. These table-top instruments feature one or more broadband light emitters, such as incandescent lamps or blackbody radiators. Such sources provide a broad emission spectrum, but this comes at the expense of a low total output power and thus a low power density. A moving-mirror interferometer ensures wavelength discrimination or filtering, while detection is performed by a single photodetector. For static filtering, instrument designers may turn to prisms or arrayed waveguide gratings. These optical elements spatially separate different wavelengths, which are detected with a separate photodetector.
An alternative approach is to undertake wavelength discrimination on the laser side, using a wavelength tuneable laser. Merits of this methodology are minimising the number of components and employing the highest possible spectral power density, but there is complexity, associated with the tuneable laser. This can be in the form of an external cavity tuneable laser, which serves in the most advanced spectroscopic applications, such as cold atoms to gas sensing, and the detection of explosives and drugs. However, up until now the downsides of this approach have been the high cost and complexity of the laser, preventing this precision instrument from being deployed in many applications.
Spectrometers on a chip
At Brolis Sensors Technology of Vilnius, Lithuania, we are changing this state-of-affairs with our GaSb-based chips – they promise to revolutionize the sensing market. A year ago, in the first edition of this magazine, 2021, we detailed our path towards the realization of a spectrometer-on-a-chip with the potential to drive a paradigm shift in the sensing application domain. Twelve months on we are now in a position to share our latest advances that have propelled our technology to the doorstep of multiple markets.
Semiconductor technology is renowned for its capability to scale. This enables widespread adoption, driven by strengths that include a highly parallel technology, a low-cost potential, and an extremely small form factor. All these attributes hold for infrared spectroscopy – it has huge potential to be deployed in a wide range of applications, and drive a transformation from what is today an offsite laboratory test, directly in the field, to a real-time measurement capability. To enable this to happen, all functional blocks of the spectrometer – including the light source, the wavelength discriminator or filter, and the detector – need to be semiconductor-based technologies that can be drawn together.
When it comes to the infrared, III-Vs are ideal for producing the light source and the photodetector technologies, with different materials better suited to different spectral regions. GaAs and InP are well established in markets from consumer to datacom, while GaSb is still either overlooked or largely unexplored when it comes to real market applications. However, GaSb has the largest potential for spectroscopy and sensing applications.
Our approach involves using a widely tuneable laser, realized by the hybrid integration of a GaSb-based gain-chip with a silicon photonic integrated circuit that houses all the wavelength tuning, filtering and locking blocks. Optical signals are sent to the object under test, prior to collection by either a discrete GaSb-based photodetector or an array of them. The response of these photodetectors is optimised for the spectrum of the laser spectrometer (see Table 1 for the main technical features of the technology platform, including the necessary semiconductor-based ingredients).
One of the features of our spectrometer-on-chip is the edge-coupling of GaSb gain-chips to mode-converters on the PIC side. Optimising this coupling is not easy, demanding alignment tolerances better than 0.5 mm. We meet this requirement with integration by glue or a solder, such as AuSn. A linear array of flip-chip integrated photodiodes monitors internal signals, such as the laser output and the degree of wavelength locking.
Brolis runs all in-house hardware infrastructure in Vilnius, Lithuania and Ghent, Belgium.
For our initial prototype, we produced a 4-channel chip with a footprint of just 5.6 mm2. This device provides spectral coverage greater than 400 nm (see Figure 2). It is easy to increase or reduce the number of channels so that they are suited to the final application.
We selected a 4-channel configuration to demonstrate the promise of our technology, because this provides a spectrometer that is suitable for many applications. For instance, applications involving the sensing of liquid-phase objects, such as fluids or tissue, require a large spectral bandwidth. Typically, a bandwidth between 200 nm and 300 nm is sufficient for monitoring one or more molecules with absorption in the same spectral region. With our spectral region of choice, spanning 1850 nm to 2450 nm, we can cover various molecules, including glucose, lactate, urea, ethanol, lactose, albumin, cholesterol, milk fat and milk protein.


Figure 2. (a) Brolis has all its in-house hardware infrastructure in Vilnius, Lithuania and Ghent, Belgium. (b) Brolis 4-channel laser spectrometer-on-chip on a PCB next to a 1 Euro cent coin (left), and a close-up of the system-on-a-chip (right). The optical output is surface-normal to the chip surface.
What’s more, we can identify and monitor large-molecule compounds, as they have a specific spectral shape. This includes the likes of collagen and carotene (see Figure 3, which illustrates several different molecules falling within the spectral bandwidth of our chip). Note that by using two channels, we can sense molecules that are spectrally close together (see Figure 4).

Figure 3. Normalized absorbance for different molecules that fall into the Brolis spectrometer-on-chip bandwidth.
For applications that involve spectroscopic sensing, there is a need to consider: mode purity, the scan speed or rate, how stable the wavelength is, and the power stability at a given wavelength. In addition, for handheld, wearable or battery-operated products, the output power and input power also matter.
Back at the beginning of last year we were unable to offer firm answers to questions related to these considerations, because what can be accomplished hinges on the optimisation and successful combination of all layers of our technology – from the chip to the photonic integrated circuit and integration. It is only in the last few months that we have finally been able to shed some light on what those answers might be. Our latest integrated spectrometer-on-a-chip provides pure single-mode operation at every wavelength. When providing fast sweeping, it takes around just 12 ms to record around 300 nm, realised with a resolution of at least 0.3 nm. By compromising speed, it is possible to provide fully continuous tuning with an additional phase control – this may be desirable for liquid or multi-gas sensing, or both.
Two striking features of our spectrometer-on-chip are its stability and mode purity. The sidemode suppression ratio is maintained above 50 dB for the entire operation across a 265 nm bandwidth (see Figure 4). This is hard to beat by any table-top system or instrument.

Figure 4. The spectral output of a 2-channel laser spectrometer-on-chip with a resolution of 0.3 nm.
Additional attributes of our patented technology are its excellent wavelength and power stability across an extended period of uninterrupted operation (see Figure 5). Without the aid of any outlier correcting software, we achieve a relative power stability of over 99 percent at a set wavelength. During an extended period of uninterrupted operation, wavelength stability – that is, the accuracy between set and actual wavelengths – is 97 percent. Again, such a high level of performance is hard-to reach with most table-top lab instruments. But in our case it comes from just a tiny chip. This highlights that we have a great technology with a real potential for advancing spectroscopy, through an expanded product range that will serve a vast number of applications.


Figure 5. (a) A Brolis spectrometer-on-chip under test. (b) Spectrometer-on-chip wavelength accuracy, determined during uninterrupted sweeps for nearly a million wavelengths and
14 hours of sweeping. Accuracy without any outlier correction is at least 97 percent. (c) The relative power of a spectrometer-on-chip at wavelength fluctuation during uninterrupted sweeps for nearly a million wavelengths and 14 hours of sweeping. Power stability is better than 99 percent.
Another strength of our technology is its power ratings – primarily the power output and the power consumption. It is important to point out that there is no universal output power level that separates what is and is not acceptable for all applications. Instead, criteria must be established on a case by case basis. However, having said that, some numbers are possible to define. Based on our own internal work we have identified that most in-vitro applications need around 0.1-0.2 mW of CW laser power when using our GaSb detector. Note that this is the level for a single-mode laser, and does not correspond to the total power of a broadband emitter, but should rather be compared with a spectral power density, which is usually expressed in power/nm.
Governing the power consumption of our spectrometer-on-chip is its laser. To minimise what it draws, its threshold current should be as low as possible, as this ensures that the operational output power is realised at the lowest possible drive current. As we routinely achieve thresholds between 20 mA and 50 mA, we can operate at currents in the 100 mA to 150 mA range, and use input powers of around 100 mW. Such powers are very promising for a very broad range of applications – from implantable biosensors to wearables, handhelds and remote-operation sensors. By combining a low power consumption with a small form factor and a monolithic design, our spectrometer offers stabilization and simple, reliable operation over an extended period of time.
The road ahead
We are pursuing parallel paths for the development of our products, and the applications that they will serve (see Table 2). Essentially, our products are ‘simple engines’ plus data. For every new application, every new molecule requires a dedicated application development experimental campaign. As this places a cost on resources, we must decide carefully what to pursue, based on considerations such as the demands of resource, the market opportunity and strategic interest.

Table 2. Brolis spectroscopic sensor product list and market readiness.
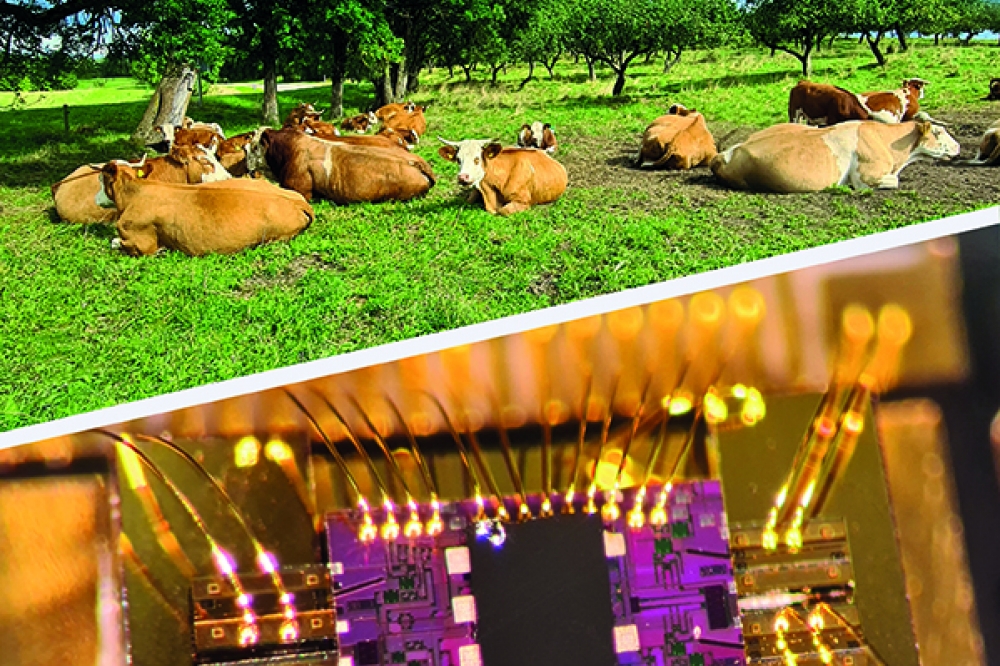
On dairy farms, spectroscopic sensing allows individual cow monitoring for critical molecular data. This can include the monitoring of lactose, fats, and proteins, and provide insight into productivity and herd health status. By drawing on accumulated data models, farmers can foresee the onset of health issues such as ketosis, mastitis and acidosis. This information may lead to antibiotic-free treatment and minimise off-line losses. Additional key metrics for those running dairy farms are the total volume of milk and how rich it is in proteins and fats. Individual animal data monitoring can capture all of this and enable efficient herd selection, and ultimately enhance the profitability of the business (see Figure 6 for performance data provided by our in-line dairy farm sensor).
There are also important, challenging, high-potential applications involving blood. We are targeting an in-vitro handheld blood spectrometer, by working towards a sensor for detecting multiple molecules, such as glucose, lactate, cholesterol and urea. This combination provides valuable insight into diet, kidney function, fatigue and metabolism in general. We are intending to have a pre-market prototype ready by the end of 2023 that will be suitable for at least several molecules. Further ahead, we have plans for in-vivo or non-invasive sensing. Our first product will be a non-invasive blood alcohol (ethanol) sensor. We hope to follow this with devices that detect and monitor additional molecules (see Figure 7 for details of our in-vitro and in-vivo developments.


Figure 6. (a) A Brolis in-line milk analyser. A spectrometer-on-chip measures the composition of milk during milking in-flow and real-time. (b) Accuracy of the in-line, in-flow, real-time milk analyser for milk fat, lactose and protein. (c) A one-day milk analyser trend data compared with a laboratory reference for milk fat, protein and lactose.
The spectroscopic sensing of milk and blood provide just a couple of illustrations of the capability of our chip technology. We have no doubt that many more products will follow – and in that light, we believe that over the next few years we will demonstrate some very exciting products, breaking new ground in functionality, form-factor and applicability.
Figure 7. (a) In-vitro prediction of blood glucose for a diabetic patient with an accuracy of slightly above 1 mmol/l or 20 mg/dl. (b) In-vivo trend for a 5-day transdermal blood ethanol detection in animal study. 1 per mil blood ethanol is visible and detected through the skin.