Precision profiler sets bar for epiwafer doping gauge
Most of the tools in use today hardly differ from the original ECV products that were launched onto the R&D market in the 1980s. This lack of evolution means that, compared with other ubiquitous compound semiconductor metrology techniques such as photoluminescence and X-ray diffraction, ECV has failed to mature in terms of accuracy, reproducibility and automation. However, we believe that a new tool represents a step forward in terms of ECV measurement performance, with significant improvements in repeatability and reproducibility.
ECV profiling was invented in the early 1970s (Ambridge and Faktor 1974) at the British Post Office Research Centre. The researchers required a convenient, high-depth-resolution method to reveal carrier-concentration variations through complex epitaxial layer structures. Their solution was an extension of the well-established CV technique that calculates the average carrier concentration from capacitance measurements across a Schottky-barrier depletion region.
Automated profilingThe modified approach substitutes an electrolyte for the conventional metal contact. By formulating the electrolyte so that it produces a well-defined electrochemical dissolution reaction with the semiconductor material, the researchers developed an automated ECV profiling system with nanometer-etch-depth resolution across a dynamic doping concentration range of 1 x 10¹³ to 1 x 1020 cm-3. Today, a number of electrolytes enables profiling through most III-V, II-VI and group IV materials.
The ECV profile measures the "net electrical effect" of the dopant atoms introduced into the epitaxial layer during growth, hence the effective depth resolution is limited to around a Debye length, and is, therefore, inversely proportional to the square root of the doping concentration. The electrically active nature of an ECV profile complements secondary-ion mass spectrometry (SIMS), an accepted but more expensive way to depth profile the atomic distribution of dopant atoms.
Because they were originally designed for an R&D environment, where flexibility is paramount, and manual handling of electrolytes and wafers are secondary issues, today s instruments are not suited to a volume-manufacturing environment. Now the ever-maturing compound semiconductor industry demands greater accuracy, reproducibility and ease of use, and this has mandated a fresh look at the technique.
Many of the limitations associated with ECV profiling can be traced to the electrochemical cell design. ECV measurements usually involve manually loading a sample against a specially designed O-ring that defines the electrolyte s contact area on the sample. The O-ring must be soft enough to form a seal with variable semiconductor surfaces, but sufficiently rigid to precisely define the Schottky contact area. Since sample loading is operator dependent, this process inevitably is subject to run-to-run variability.
Absolute accuracy of the carrier concentration and etch depth depends on a precise measurement of the contact area. This critically important calibration is often ignored, and even if it is performed, it is not updated frequently enough to track gradual changes in area over time. Additional inaccuracies can arise from bubbles in the O-ring or O-ring distortion and wear resulting from unintentional variations in the pressure holding the sample against it.
Electrical-contact problems can also introduce measurement variations. To determine capacitance, an ohmic contact is formed either via a back contact to a conducting substrate or directly through a front contact to the epitaxial layers. Contact quality on older systems can vary and lead to unreliable results. Other issues can arise from samples with too high a series resistance for the over-simplified electronics and modeling of the semiconductor-electrolyte interface.
Sometimes the materials themselves require etch-method improvements. GaN and its ternary compounds, for example, present difficult chemistry for ECV profiling that can be overcome by pulsed etching, with sequential film formation followed by removal. Although older ECV tools include software features for pulsed etching, they lack sufficient electrolyte-circulation control and refreshment to carry out this process effectively.
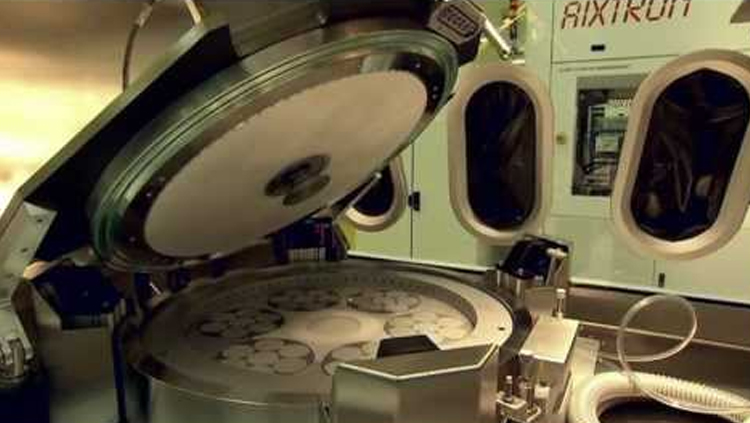
Eliminating the wet benchAddressing these limitations, Accent has launched a completely redesigned profiler, the ECVPro, which greatly simplifies sample handling by allowing whole wafers to be placed onto a horizontal stage (see figure 2). The automated electrolyte handling reduces operator contact with the chemicals and eliminates the need for an adjacent wet bench.
To determine the doping concentration, the wafer is positioned on the horizontal stage and front-surface contacts are lowered to make an ohmic contact. The stage is then raised to the vertical position and the electrochemical cell moves forward, applying a consistent pressure between the wafer and the O-ring. Electrolyte then circulates through the O-ring, removing any trapped bubbles and preparing the sample surface for profiling.
The electronics and modeling software have also been dramatically improved, partly through introduction of multifrequency capabilities. To ensure traceability of results in a manufacturing environment, the system now automatically compares capacitance measurements to a built-in traceable standard.
These refinements deliver a major improvement in reproducibility, which has been verified externally. Data provided by a major LED manufacturer show a standard deviation of 4% in measured carrier concentrations. Variance was calculated for 245 measurements taken with full load/unload cycles and different operators (figure 3). To put this figure in perspective, identical tests using the previous generation of tools produced a standard deviation of 20%.
To reduce errors resulting from an imprecise measurement of the contact area, a built-in camera is incorporated into the ECVPro s etch cell. This camera gives a calibrated, high-resolution image of the etch area after the profile is completed. Software then calculates and logs the contact area determined from the camera image, maintaining a calibration history of the O-ring. Tool calibration then ceases to depend on the operator, ensuring a high level of accuracy and repeatability.
To test these capabilities, an epiwafer manufacturer provided a highly uniform GaAs epilayer on a semi-insulating substrate. Non-contact resistivity mapping confirmed the wafer s excellent uniformity. The resistivity contour map revealed a circular pattern with a slightly lower resistivity in the wafer center. To evaluate the ECVPro s repeatability, 50 ECV measurements were taken on the wafer, roughly following the circular contours of the resistivity map. The standard deviation calculated from all 50 measurements was 1.5%. However, variations in resistivity across the wafer are probably due to changes in carrier concentration rather than thickness fluctuations, so the standard deviation describing repeatability is actually less than 1%.
The built-in camera provides additional benefits, such as dynamic observation of bubble formation and removal, and the option to view and record images of the electrolyte-semiconductor interface throughout the profile-etching process. When profiling complex heterostructures, these images show the physical interfaces between heterostructure layers that are reached during the etching process (see figure 4).
The images can also show material defects revealed through localized changes in etching current densities, a particularly useful feature when profiling less mature material systems, such as nitrides.
The III-nitride material system presents a tougher challenge for ECV profiling. Although n-type GaN, InGaN and AlGaN layers are reasonably easy to profile if the correct electrolyte concentration and etching procedure is used, p-type GaN is much more awkward. Problems result from a combination of poor conductivity, rough surfaces and high defect densities. However, GaN-based LED profiles are possible with a custom process that uses lower measurement frequencies and accurate electrical models.
An ECV profile of a standard GaN-based LED structure supplied by a European MOCVD equipment supplier is shown in figure 5, alongside SIMS measurements on the same sample. N-type layer measurements by ECV and SIMS provide similar values for the carrier concentration. However, the p-type ECV carrier concentration level is one-tenth of the atomic magnesium concentration obtained by SIMS. This difference reveals the complementary nature of the techniques; only a fraction of the magnesium acceptors contribute to the hole conductivity, and that proportion can be determined by examining the ratio of the two measurements.
ECV profiling is a flexible technique that can be adapted to continually evolving materials systems. Despite its presence as a mainstay characterization approach, ECV profiling has always had a reputation as a troublesome and highly operator-dependent technique. In the GaN world it is widely believed that accurate ECV profiling is just plain impossible. However, we believe that the improvements incorporated in the new generation of ECV profilers enables ECV profiling as a viable, accurate and highly reproducible technique, equally at home in development and high-volume manufacturing environments.
ECV profiling provides powerful insights into doping profiles and variations in simple and complicated heterostructures across a range of material systems. It represents a low-cost and in-house alternative to SIMS that is reliable and free of operator error.
Further reading
T Ambridge and M M Faktor 1974 J. Applied Electrochem. 4 135.
P Blood 1986 Semicon. Sci. Technol. 1 7.
N F Jackson Semicon. Sci. Technol. 7 686.