Comprehensive inspection techniques can underpin high-yield LED manufacturing
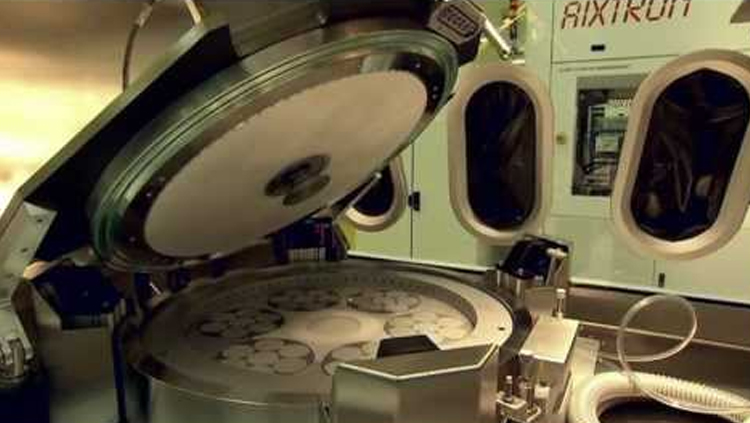
The LED industry is not standing still. Leading manufacturers are upgrading production to 6- inch wafers and turning to LED architectures that are significantly more sophisticated – two trends that increase the cost invested at the die and wafer level. Where these chips are going is also shifting, with more and more of them being deployed in automobile headlights, LED TVs, personal electronics and architectural lighting. The emergence of the incredibly lucrative solid-state LED lighting market is also underway, which should enable widespread replacement of conventional incandescent lighting with energy efficient, mercuryfree, alternatives.
This evolution of the LED industry has impacted the approach taken to inspect the product during its manufacture. In the past, manufacturers had minimal incentive to deploy in-line yield-improvement strategies because the cost-per-device was low, and the applications for these LEDs were far less demanding on chip performance. Back then, a “testand- sort” methodology involving selection of good devices at the final production stage could satisfy customer requirements.
Today it’s very different. Not only are customers demanding far higher, tighter specs – the price of the LED has also plummeted, and chipmakers must hit higher yields to ensure profitability. Consequently, most leading manufacturers are turning to comprehensive yield management methods to better serve the needs of their markets while retaining cost competitiveness. At KLA Tencor, a US-based manufacturer of inspection tools for the semiconductor industry, we are firm believers in the benefits of a holistic approach to LED yield management strategy. Ideally this should include: inline automated inspection at key points throughout the production process; fast detection of process excursions; timely root cause identification through Defect Source Analysis; use of advanced Spatial Signature Analysis; and a comprehensive universal software system for aggregating, analysing and utilizing information to minimize propagation of production errors and drive timely corrective actions.
Tremendous opportunities
Two key targets set out in the US Department ofEnergy’s roadmap for solid-state lighting are adoubling of LED efficiency and a halving of its priceper lumen over the 2009-2015 timeframe (see Figure 1). To fulfil these goals, more than half of the cost reduction will have to come from improvements to inline inspection, process control and other techniques to increase yield.
 Figure 1: In-line inspection and yield management will cut the cost and improve the performance of LED manufacturing
If LED fabs continue to employ manual methods for defect and yield analysis, they will fail to increase yields enough to get the chip costs down by 50 percent or more. With this traditional approach, the bulk of engineering time is spent gathering and formatting information – little time is devoted to the crucial tasks of analysis and taking corrective actions where appropriate. In addition, this outdated approach suffers from inconsistency within manual data collection methods, plus the absence of a comprehensive approach to relate critical information between different production processes, such as inspection of bare wafers, epitaxial films, patterned wafers and dice.
This inefficient combination of slow data collection and little analysis can fail to quickly address a process that is deviating beyond acceptable parameters and leading to the production of a large number of bad die. There is additional cost, too – the expense associated with all operations performed on the bad parts in subsequent production steps. What is abundantly clear from empirical data is that by deploying sophisticated in-line inspection tools at key points early in the process, it is possible to garner excellent predictive information regarding yields resulting from subsequent steps. This gain is highlighted in die maps that compare predicted failures according to post-epi inspection with actual failures during electrical testing (see Figure 2). These maps expose the high correlation between epitaxial defects and LED failures at electrical test - more than 52 percent of the predicted bad die result in electrical failures.
Figure 1: In-line inspection and yield management will cut the cost and improve the performance of LED manufacturing
If LED fabs continue to employ manual methods for defect and yield analysis, they will fail to increase yields enough to get the chip costs down by 50 percent or more. With this traditional approach, the bulk of engineering time is spent gathering and formatting information – little time is devoted to the crucial tasks of analysis and taking corrective actions where appropriate. In addition, this outdated approach suffers from inconsistency within manual data collection methods, plus the absence of a comprehensive approach to relate critical information between different production processes, such as inspection of bare wafers, epitaxial films, patterned wafers and dice.
This inefficient combination of slow data collection and little analysis can fail to quickly address a process that is deviating beyond acceptable parameters and leading to the production of a large number of bad die. There is additional cost, too – the expense associated with all operations performed on the bad parts in subsequent production steps. What is abundantly clear from empirical data is that by deploying sophisticated in-line inspection tools at key points early in the process, it is possible to garner excellent predictive information regarding yields resulting from subsequent steps. This gain is highlighted in die maps that compare predicted failures according to post-epi inspection with actual failures during electrical testing (see Figure 2). These maps expose the high correlation between epitaxial defects and LED failures at electrical test - more than 52 percent of the predicted bad die result in electrical failures.
 Figure 2: Automated wafer inspection correlates epitaxial defects with electrical failures, which were assessed at the end of the manufacturing process
This high “kill ratio” strongly suggests that there is a problem in the epitaxial chamber. However, without the benefit of in-line epitaxial inspection coupled with timely analysis and corrective action, this problem could continue unchecked for two to four weeks, before the error spike shows up in final ‘e-test’. In an LED fab running 20,000 wafers per month, this problem could remain hidden until 10,000 to 15,000 wafers with high defect rates are produced. By itself, integration of in-line epitaxial inspection with timely analysis and correction can save millions of dollars per year in a typical LED fab.
Manual verses automatic
Although in-line inspection of epiwafers paysdividends, even greater yield improvements arepossible when this is combined with otherapproaches (see Figure 3). We believe that in orderto identify process excursions in real-time andsupport timely corrective actions, automated in-lineinspection is essential at all key points in themanufacturing process, which must be used inconjunction with well-targeted Statistical ProcessControl (SPC). It is imperative to deploy in-lineinspection at the points where the defects are beingcreated and to implement corrective actions in realtime.This works best when the approach goesbeyond simple-minded “total defect count” SPCmethods and instead utilises the most advancedmethods.
Figure 2: Automated wafer inspection correlates epitaxial defects with electrical failures, which were assessed at the end of the manufacturing process
This high “kill ratio” strongly suggests that there is a problem in the epitaxial chamber. However, without the benefit of in-line epitaxial inspection coupled with timely analysis and corrective action, this problem could continue unchecked for two to four weeks, before the error spike shows up in final ‘e-test’. In an LED fab running 20,000 wafers per month, this problem could remain hidden until 10,000 to 15,000 wafers with high defect rates are produced. By itself, integration of in-line epitaxial inspection with timely analysis and correction can save millions of dollars per year in a typical LED fab.
Manual verses automatic
Although in-line inspection of epiwafers paysdividends, even greater yield improvements arepossible when this is combined with otherapproaches (see Figure 3). We believe that in orderto identify process excursions in real-time andsupport timely corrective actions, automated in-lineinspection is essential at all key points in themanufacturing process, which must be used inconjunction with well-targeted Statistical ProcessControl (SPC). It is imperative to deploy in-lineinspection at the points where the defects are beingcreated and to implement corrective actions in realtime.This works best when the approach goesbeyond simple-minded “total defect count” SPCmethods and instead utilises the most advancedmethods.
 Figure 3: Patterning defects are a bigger cause of yield loss than epi-related issues
Interestingly, experience shows that the size of the excursion is less important than the time that it takes to discover and correct it. ‘Major’ excursions can even be spotted with inefficient manual methods, so the risk that they will impair production yields is fairly low. In comparison, it is far harder to uncover more subtle “minor” process excursions, which do not show a dramatic deviation beyond acceptable parameters. These can go undetected for considerable time, putting more product at risk and increasing the potential for big financial losses. This view has been backed up with empirical financial analysis, which shows that a one-sigma variation is more damaging than a three-sigma or ten-sigmavariation. Automated in-line inspection can capture these small deviations by narrowing the distribution and enabling much cleaner SPC charting (see Figure 4).
Figure 3: Patterning defects are a bigger cause of yield loss than epi-related issues
Interestingly, experience shows that the size of the excursion is less important than the time that it takes to discover and correct it. ‘Major’ excursions can even be spotted with inefficient manual methods, so the risk that they will impair production yields is fairly low. In comparison, it is far harder to uncover more subtle “minor” process excursions, which do not show a dramatic deviation beyond acceptable parameters. These can go undetected for considerable time, putting more product at risk and increasing the potential for big financial losses. This view has been backed up with empirical financial analysis, which shows that a one-sigma variation is more damaging than a three-sigma or ten-sigmavariation. Automated in-line inspection can capture these small deviations by narrowing the distribution and enabling much cleaner SPC charting (see Figure 4).
 Figure 4: Manual inspection introduces a substantial amount of noise into any measurement. The upshot is that deviations can go unnoticed when manual inspection is used, but are easy to spot when automated inspection is employed
One of the major downsides of manual inspection is that it is inherently dependent on a variety of uncontrolled variables, including the level of operator training, time of day, attentiveness to task, inspection speed and the amount of product that can be inspected. The upshot of all these uncontrolled variables is excessive “noise” in the statistical distribution of inspection results, which makes it far harder to uncover subtle process excursions (see Figure 4). In contrast, automated in line inspection systems eliminate subjectivity and variability in the inspection process. Engineers can then direct all their focus at identifying variability in the production process, which speeds the identification of minor excursions that have the potential to make a major impact. Automated in-line inspection stations can be deployed at key points throughout the fab, tailored to the complexity of the particular LED fab processes (see Figure 5). If customers choose to employ our tools, they will be equipping their chipmaking facilities with inspection technologies and platforms that have already undergone extensive evolution and refinement in fabs making silicon ICs.
Figure 4: Manual inspection introduces a substantial amount of noise into any measurement. The upshot is that deviations can go unnoticed when manual inspection is used, but are easy to spot when automated inspection is employed
One of the major downsides of manual inspection is that it is inherently dependent on a variety of uncontrolled variables, including the level of operator training, time of day, attentiveness to task, inspection speed and the amount of product that can be inspected. The upshot of all these uncontrolled variables is excessive “noise” in the statistical distribution of inspection results, which makes it far harder to uncover subtle process excursions (see Figure 4). In contrast, automated in line inspection systems eliminate subjectivity and variability in the inspection process. Engineers can then direct all their focus at identifying variability in the production process, which speeds the identification of minor excursions that have the potential to make a major impact. Automated in-line inspection stations can be deployed at key points throughout the fab, tailored to the complexity of the particular LED fab processes (see Figure 5). If customers choose to employ our tools, they will be equipping their chipmaking facilities with inspection technologies and platforms that have already undergone extensive evolution and refinement in fabs making silicon ICs.
 Figure 5: Key LED process points for deploying automated inline inspection based on third generation tools
Our automated tools employ advanced optics that features scan and detection algorithms for enabling high-throughput, high-sensitivity inspection. It is easy to configure them for both smaller die sizes that are difficult to handle with manual methods, and larger die sizes that require rapid yield improvement. At the final output step, these automated inspectors also combine go/no-go assessment and accurate multibin defect classification with rule-based binning algorithms.
Exposing defects
Ideally, process engineers in LED fabs will quicklyspot excursions at key production steps. This willempower them to determine root causes and takecorrective action before the wave of cumulativeerrors propagates throughout the rest of theproduction line. The good news is that this isrelatively easy to do when automated in-lineinspection is combined with Defect Source Analysis(DSA), which can relate the various sources ofdefects to impacts later in the production sequence.
Defect information, such as from the Klarity LED product, from key points throughout the production flow is communicated to the centralised database as industry-standard KLARF data (KLA Report File). This data can include images, sort/bin data, and other fab inputs that enable seamless correlation of information from throughout the fab (see Figure 6). Each KLARF contains detailed information, including the ID, location and size of the defect, as well as other information from the inspection tools. Engineers can access the defect data in the centralized database from PC-based clients through the system, enabling them to quickly perform a range of analysis functions, such as creating/updating SPC control charts, or generating wafer maps, Pareto charts or image galleries to support DSA activities.
Figure 5: Key LED process points for deploying automated inline inspection based on third generation tools
Our automated tools employ advanced optics that features scan and detection algorithms for enabling high-throughput, high-sensitivity inspection. It is easy to configure them for both smaller die sizes that are difficult to handle with manual methods, and larger die sizes that require rapid yield improvement. At the final output step, these automated inspectors also combine go/no-go assessment and accurate multibin defect classification with rule-based binning algorithms.
Exposing defects
Ideally, process engineers in LED fabs will quicklyspot excursions at key production steps. This willempower them to determine root causes and takecorrective action before the wave of cumulativeerrors propagates throughout the rest of theproduction line. The good news is that this isrelatively easy to do when automated in-lineinspection is combined with Defect Source Analysis(DSA), which can relate the various sources ofdefects to impacts later in the production sequence.
Defect information, such as from the Klarity LED product, from key points throughout the production flow is communicated to the centralised database as industry-standard KLARF data (KLA Report File). This data can include images, sort/bin data, and other fab inputs that enable seamless correlation of information from throughout the fab (see Figure 6). Each KLARF contains detailed information, including the ID, location and size of the defect, as well as other information from the inspection tools. Engineers can access the defect data in the centralized database from PC-based clients through the system, enabling them to quickly perform a range of analysis functions, such as creating/updating SPC control charts, or generating wafer maps, Pareto charts or image galleries to support DSA activities.
 Figure 6: The best approach to defect analysis begins with the aggregation of defect data in a centralized database
Thanks to automated event-based triggers, engineers – who can access a full range of inspection data and perform extensive analysis functions directly from their desks or workstations – can quickly determine root causes of defects without having to make multiple trips into the cleanroom or assemble and tabulate defect data by hand. It is also possible for engineers to track the morphology of defect changes from layer to layer throughout the process with a Defect Transition Table (DDT), an advanced feature of DSA. This allows them to narrow the search for the sources of problems, and it also supports tracing of the transition of defects on a wafer as this moves between steps in the flow. Using DDT in combination with quantitative layer-by-layer ‘adder’ analysis and wafer map galleries allows rapid identification of root causes. By being able to compare data and images from throughout the process, engineers are also better placed to see the ‘big picture’ and determine interrelationships that are not obvious. The result: faster, more accurate DSA for supporting corrective actions.
Another powerful tool is Spatial Signature Analysis (SSA). This enables detection and classification of spatial signatures, such as defect clusters and patterns, which can indicate an out-of-spec process or a process tool problem. Tailored SSA recipes can be set up to automatically identify, analyse and characterize process-induced signatures and defect clusters for specific LED designs. This allows SSA to automatically alert the engineer to process excursions based on signature classification and analysis, even if wafers have a defect count that is within spec. SSA also enables defect signature monitoring by zone, associating spatial signature classes - including ring, radial, scratch, and line - with pre-defined areas of the wafer, such as its edge. By using SSA in combination with SPC and DSA, engineers can utilise quantifiable data to support timely, real-world decision making. For example, it is possible to set up trend charts to monitor the occurrence of specific edge signatures and/or clusters. Feedback from DSA functions can also be used to confirm and/or modify SSA rules and SPC charts.
What’s more, SSA signature data can be used to identify and ignore non yield-limiting nuisance defects that do not impact failure rates. For example, post-epi particle defects rarely impact LED yield, but if they occur in large numbers and vary significantly from lot-to-lot they can trigger a false excursion event. SSA algorithms can be pre-tuned to recognize such conditions and to avoid false alerts.
Engineers have the option to use the SSA Recipe Editor to effectively “train” the SSA node, by customizing rules and incorporating signatures from sample wafer data (see Figure 7). This can lead to refinements of process control methods, if SSA recipes are saved into the universal database and linked to DSA files and SPC charts.
Figure 6: The best approach to defect analysis begins with the aggregation of defect data in a centralized database
Thanks to automated event-based triggers, engineers – who can access a full range of inspection data and perform extensive analysis functions directly from their desks or workstations – can quickly determine root causes of defects without having to make multiple trips into the cleanroom or assemble and tabulate defect data by hand. It is also possible for engineers to track the morphology of defect changes from layer to layer throughout the process with a Defect Transition Table (DDT), an advanced feature of DSA. This allows them to narrow the search for the sources of problems, and it also supports tracing of the transition of defects on a wafer as this moves between steps in the flow. Using DDT in combination with quantitative layer-by-layer ‘adder’ analysis and wafer map galleries allows rapid identification of root causes. By being able to compare data and images from throughout the process, engineers are also better placed to see the ‘big picture’ and determine interrelationships that are not obvious. The result: faster, more accurate DSA for supporting corrective actions.
Another powerful tool is Spatial Signature Analysis (SSA). This enables detection and classification of spatial signatures, such as defect clusters and patterns, which can indicate an out-of-spec process or a process tool problem. Tailored SSA recipes can be set up to automatically identify, analyse and characterize process-induced signatures and defect clusters for specific LED designs. This allows SSA to automatically alert the engineer to process excursions based on signature classification and analysis, even if wafers have a defect count that is within spec. SSA also enables defect signature monitoring by zone, associating spatial signature classes - including ring, radial, scratch, and line - with pre-defined areas of the wafer, such as its edge. By using SSA in combination with SPC and DSA, engineers can utilise quantifiable data to support timely, real-world decision making. For example, it is possible to set up trend charts to monitor the occurrence of specific edge signatures and/or clusters. Feedback from DSA functions can also be used to confirm and/or modify SSA rules and SPC charts.
What’s more, SSA signature data can be used to identify and ignore non yield-limiting nuisance defects that do not impact failure rates. For example, post-epi particle defects rarely impact LED yield, but if they occur in large numbers and vary significantly from lot-to-lot they can trigger a false excursion event. SSA algorithms can be pre-tuned to recognize such conditions and to avoid false alerts.
Engineers have the option to use the SSA Recipe Editor to effectively “train” the SSA node, by customizing rules and incorporating signatures from sample wafer data (see Figure 7). This can lead to refinements of process control methods, if SSA recipes are saved into the universal database and linked to DSA files and SPC charts.
Summing the parts
Tying everything together is our Klarity LED comprehensive yield management software system. This leverages proven techniques that produce excellent results in the silicon industry. However, this software has been adapted to address the specific requirements and unique challenges of LED manufacturing. It caters for small die and thousands of devices on a typical LED wafer, enabling far more efficient and effective management of LED fab yields than is possible with manually managed systems. The automated software approach spans the entire production flow from end-to-end; combining yield analysis, excursion responses, front-end to back-end correlations, and corrective actions.
 Figure 7: Spatial Signature Analysis (SSA) identifies key process signatures
By adopting a holistic approach to yield management, all of the pieces of the puzzle can be brought together, leading to accelerated process development, faster ramp up of production yields, improved quality levels, faster excursion detection, and an overall more cost-effective LED manufacturing process. This will help to drive down the cost of LEDs, and fuel their deployment in emerging markets, such as general illumination.
© 2011 Angel Business Communications. Permission required.
Figure 7: Spatial Signature Analysis (SSA) identifies key process signatures
By adopting a holistic approach to yield management, all of the pieces of the puzzle can be brought together, leading to accelerated process development, faster ramp up of production yields, improved quality levels, faster excursion detection, and an overall more cost-effective LED manufacturing process. This will help to drive down the cost of LEDs, and fuel their deployment in emerging markets, such as general illumination.
© 2011 Angel Business Communications. Permission required.