Ellipsometry reveals epiwafer optical and physical properties
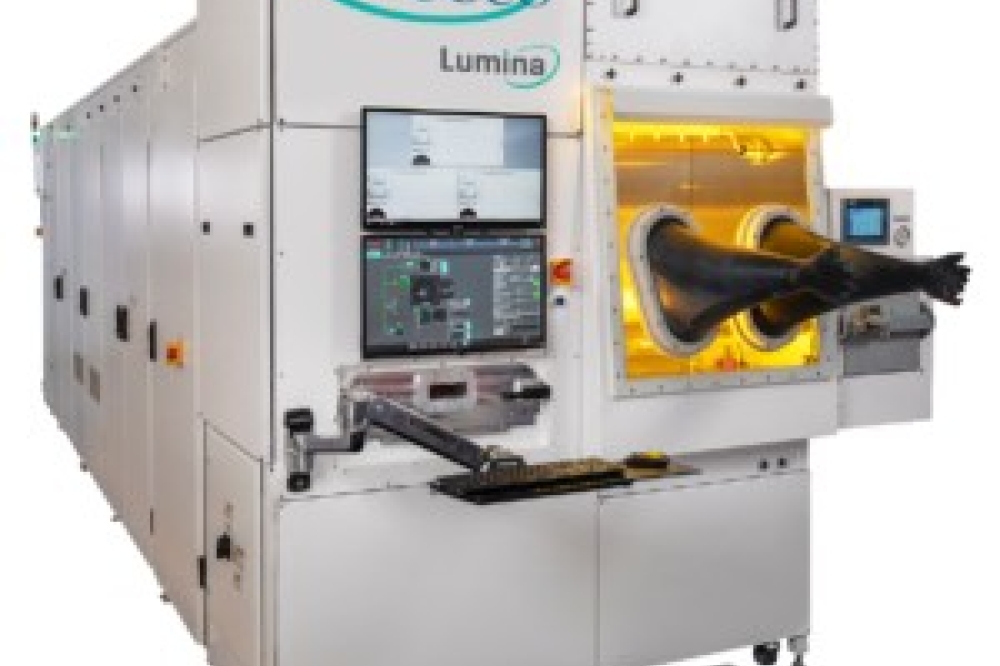
SE is now implemented in a number of different configurations. Table-top instruments are mostly used for R&D applications where sample throughput is relatively low. Larger, automated tools are commonly found in semiconductor, flat-panel display and photonic device manufacturing facilities, where ease of use and measurement speed are essential. Automation usually includes wafer handling for complete hands-free operation, analyzing one full wafer batch at a time, and the ability to map an entire wafer.
What can SE reveal about a material?
SE relies on the determination of the polarization state of a beam of polarized light reflected from the sample under characterization. When performing SE measurements, the polarization state is determined at many discrete wavelengths over a broad wavelength range. The change in the polarization state can be traced to the physical properties of the thin film by means of a model. Material characteristics such as layer thickness, surface roughness, refractive index (n) and extinction coefficient (k) can be determined with excellent precision through regression analysis (Tompkins and McGahan ).
The SE instrument determines two ellipsometry angles, Ψ and Δ, which describe the change in the polarization state of the beam upon reflection from the sample. The ratio of the amplitude of the polarization within the plane of incidence (P) to the amplitude of the polarization perpendicular to the plane of incidence (S) is represented by Ψ. The phase retardation between the two polarization vectors P and S is represented by Δ. Changes in Ψ and Δ essentially depend upon the optical constants, n and k, of the layer materials and substrate, the physical thickness of the individual layers and the surface roughness.
For a given material, the magnitude of the change in Ψ and Δ is different at different angles of incidence. A larger change gives more accurate results, and for this reason data is taken at a number of incident angles to find the angle that gives the biggest change in Ψ and Δ. Data for 100 to 200 different wavelengths are acquired at each angle. SE instruments use a white light source, and individual wavelengths are selected for detection by either a motor-driven monochromator or a multichannel detector that can detect many wavelengths simultaneously.
Increasing the number of angles and wavelengths at which data are acquired improves analysis precision, especially for complicated epitaxial structures. In recent years SE has extended further into the vacuum ultraviolet (down to 140 nm) and infrared (up to 30 µm) regions of the spectrum, enabling the technique to provide more information on material properties (see Compound Semiconductor March 2001, p76).
SE and compound semiconductors
SE has been used for the characterization of multilayer III-V compound semiconductor structures for several years. A review of the capability of the technique for characterizing such structures has been given by Pickering et al. SE is first used to establish reference spectra of n and k from material layers of different known compositions and thicknesses. For example, for an AlxGa1-xAs sample of unknown x-value and layer thickness, a number of AlGaAs samples with known values are analyzed to build a model for the material. For commonly measured materials such as AlGaAs, libraries of reference data exist. The accuracy of these libraries relies on the use of state-of-the-art material for their compilation. Poor-quality reference material gives poor-quality data, and thus any model compiled will not give accurate results for real samples.
With a good model, n, k and the material s physical properties can be determined by matching the modeled Ψ and Δ with the experimentally acquired Ψ and Δ from the unknown samples. In this way the technique can be routinely used for determining the properties of compounds of unknown composition, as well as the thickness of the individual layers in multilayer stacks.
Spectra from an InGaAs/InP epilayer structure are shown in figure 1. The measurements have been performed at three discrete incident angles, and over a spectral range extending into the near infra-red at wavelengths up to 2 µm. These spectra show that different angles of incidence give different variations in the acquired values of Ψ and Δ. Typical thickness measurement precision is indicated in figure 2, which shows the structure derived from the data in figure 1. Analysis of the data gives the layer thicknesses for the InP layer, the InGaAs layer and even the InP native oxide.
In addition, the actual optical constants of different materials can be determined over the entire spectral range, including the 980, 1310 and 1550 nm wavelengths used for optical communications, an important application for compound semiconductors.
Characterization of SiGe epilayers
A very similar procedure can be applied for characterizing SiGe epilayer structures. Here the technique is successfully used for determining the thickness of the Si layer that typically caps the SiGe layer, and the thickness and composition of the SiGe layer itself. The epilayer structure characteristics can be mapped out over an entire wafer.
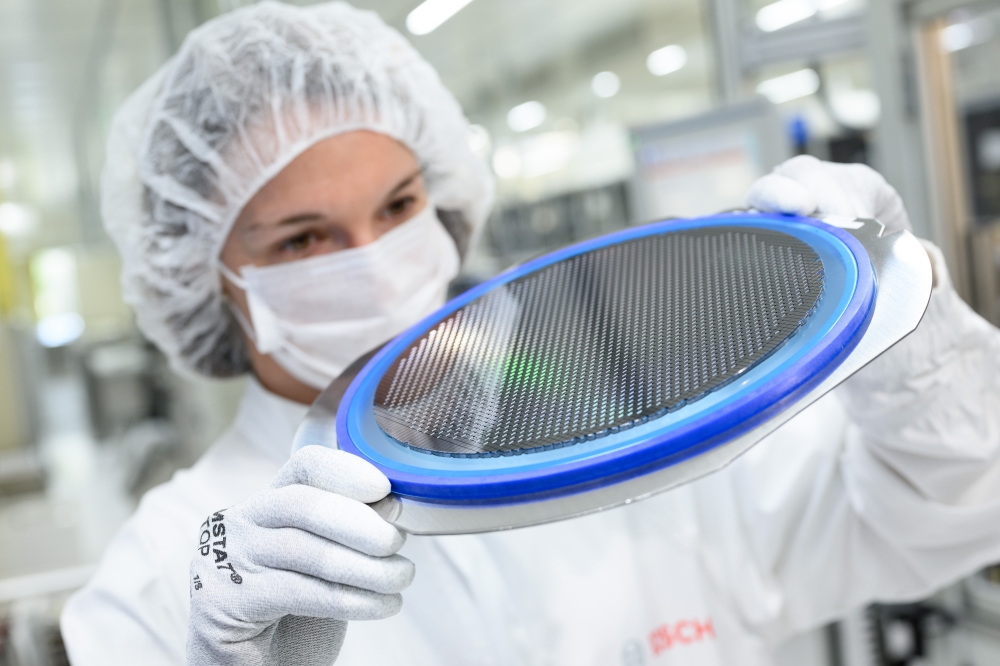
Wafer mapping is performed by mounting the wafer on a motor-driven x-y stage and then scanning it through the ellipsometer beam. As well as characterizing a whole wafer, such systems can be programmed to acquire data from specific areas of the wafer. For batches of nominally identical wafers, the same critical points on each wafer can be automatically analyzed. Figure 3 shows maps of SiGe layer and Si-cap layer thickness for a 200 mm wafer with a Si-capped Si0.92Ge0.08 layer.
Summary
Spectroscopic ellipsometry is a powerful and versatile technique for characterizing a wide diversity of semiconductor and optical multilayer materials. Layer thickness and composition, together with the optical constants of the materials over a wide spectral range, can be determined with very good precision. SE is a non-contact technique that is also non-destructive. It is readily implemented using table-top instruments, or on industrial tools with substrate handling and mapping for hands-free automated operation, making it a popular characterization technique in many production facilities.
Further reading
H Tompkins and W McGahan 1999 Spectroscopic Ellipsometry and Reflectometry (John Wiley & Sons).
C Pickering et al. 1993 Thin Solid Films 233 171-175.