Automated wafer inspection aids GaN HEMT morphology
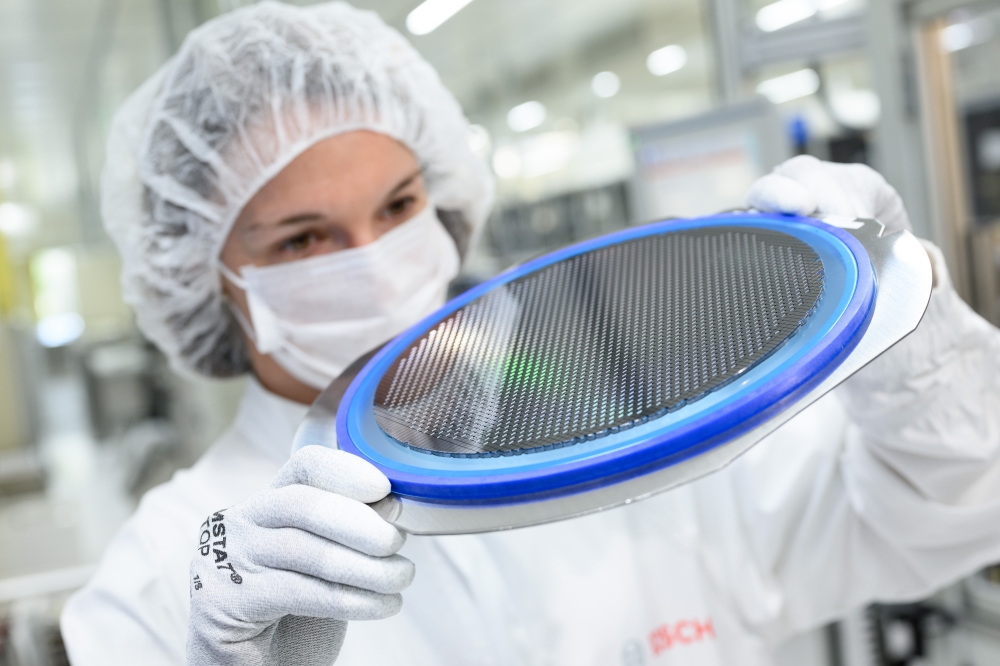
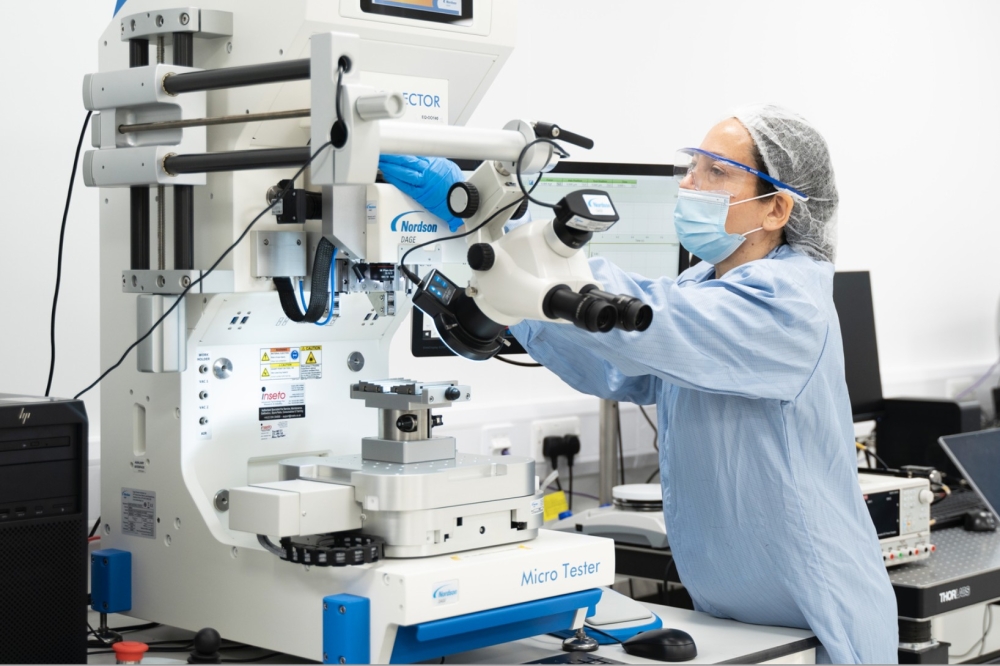
To make the transition to volume manufacturing, standard metrics are required to monitor and improve wafer quality. GaN epitaxial layers have various defects caused by substrate and epilayer growth. Although these defects can be catalogued by human operators using a microscope inspection technique, this method is time-intensive, and, in practice, can only be used to check part of the surface of a handful of wafers. In fact, such sampling can lead to erroneous conclusions about the occurrence of process defects.
An automated, high-throughput technique exists that reveals the size and type of defects across a wafer s surface by analyzing laser light that is scattered or reflected from it. Identifying defect type is important; surface particles can be cleaned off, but pits can drastically cut the device yield. This inspection process allows measurement of many more wafers, early detection of some process problems, and an opportunity to investigate the yield impact of different types of defects. The technique was restricted to opaque wafers, but now it has been extended to transparent material systems, including those based on GaN.
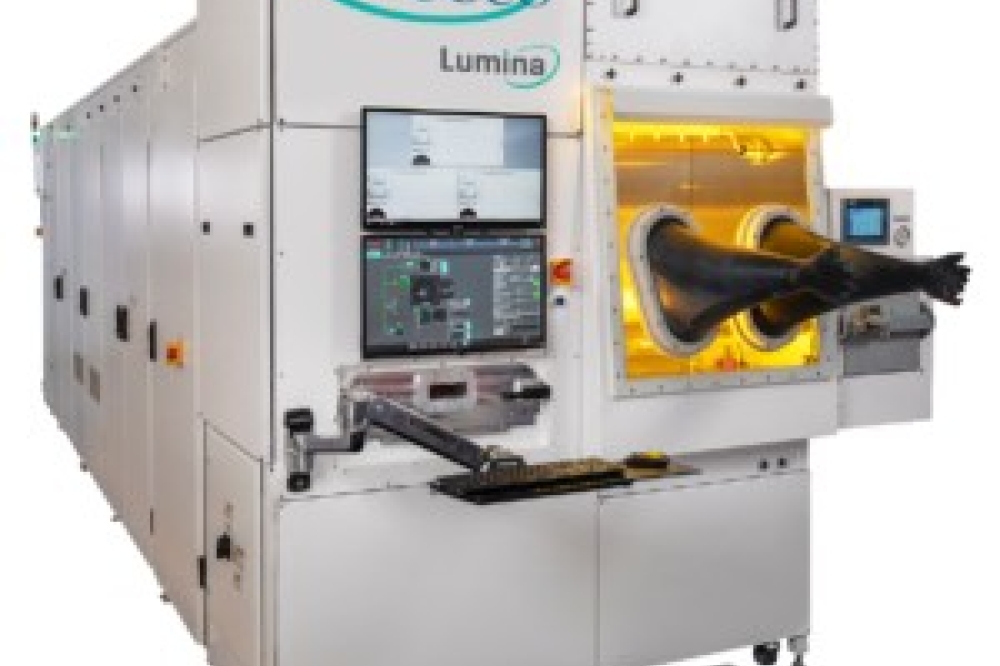
Hitachi Cable in Japan, which manufactures GaN HEMTs on both sapphire and silicon carbide substrates, has used an optical surface analyzer (OSA) designed by KLA-Tencor, of San Jose, CA, to detect and classify defects in various GaN epilayers. An OSA verifies substrate quality prior to growth and assesses the post-growth surface. This information has shown that substrate scratches tend to be smoothed out by the initial buffer epilayer, and are consequently less problematic than other types of defects, such as micropipes in SiC.
Disk-drive originsThe CS1 inspection tool used by Hitachi Cable is one of a family of OSA instruments produced by KLA-Tencor. The core technology was first developed for the magnetic hard-disk-drive industry and dates back to 1989 (Meeks 2000). The rapidly decreasing size of storage bits on disk substrates drove the need to reduce the occurrence of smaller and smaller substrate defects, in a manner analogous to the silicon IC industry. Candela Instruments, which was acquired by KLA-Tencor in late 2004, was founded to develop the CS1 automated tool.
The instrument had to be capable of inspecting transparent materials, because the disk industry had moved from using metal to glass substrates, which have higher bit densities and greater reliability owing to their stiffer, smoother nature. The tool s capabilities can also be applied to other transparent materials commonly used in the III-V industry, such as sapphire, silicon carbide, lithium niobate and lithium tantalate.
The OSA illuminates a 4 x 8 μm area of a sample surface with linearly polarized light from a 632 nm laser. It monitors reflections with a combination of detectors to measure specularly reflected intensity, phase shift, scattered light and surface topography (figure 4). The scattered-light detector is positioned directly above the measurement spot, and a separate assembly, containing the three other detectors, sits in the path of the reflected light.
Measuring signals from several different types of detector is important for defect classification, providing much more information than a conventional scatterometer. Different types of defect exhibit varying signal levels in the different channels, resulting in signatures that can be used to classify defects.
A spatial filter, or aperture, is used to prevent the detection of laser light that is refracted through the wafer surface and then reflected off of the backside of the substrate before traveling toward the detector. These backside signals often prevent conventional scatterometers from measuring transparent wafers, but the Candela tools are suitable for transparent wafers as thin as 250 μm.
The entire wafer surface can be analyzed by rotating it while a measurement head moves from the wafer s outer edge to its center. Thousands of data points are measured in a typical scan, providing information about defect types, sizes and densities. By assigning brightness levels proportional to the amplitude of the detected signal, output from the various detectors can also be converted into images similar to those produced by a microscope.
Defect classificationHitachi Cable has used an OSA to investigate the surface of a typical GaN HEMT containing an AlN buffer layer, a GaN layer and an Al0.28Ga0.72N surface layer grown on a SiC substrate. Figure 1 shows two images of an area of a wafer, before and after epitaxial growth. The images were generated by detecting SZc, the magnitude of the deflection of the reflected light. The SZc response is well-suited to defect detection because of its sensitivity to variations in surface height and reflectivity.
An OSA can also determine the origin of defects generated during the epitaxial process, as demonstrated in figure 2. For example, films, residues and particles on the substrate can cause pitting at the original defect site (a particle defect may not even be present at the end of the process). Wafer yield is reduced if particles fall on the substrate during the growth process, resulting in pitting, and scratches on a substrate can lead to deformed epitaxial layers that follow the outline of the scratch.
Other types of defect, such as stains and surface particles, that do not disturb the epitaxial layers, can also be identified with an OSA. Stain defects are revealed by the reflected light signal, while surface particles can also be seen in the scattered-light channel. Figure 3 shows images of the GaN HEMT surface obtained from a microscope and the SZc signal from an OSA. Figure 5 reveals the alternative perspectives provided by each image-acquisition mode. Combining the information from the various images can distinguish between defects generated by particles and those formed by irregularities in the substrate.
Using an OSA to investigate the epiwafer quality of GaN HEMTs has enabled defects in the substrate, such as micropipes that cause many surface defects, to be distinguished from their epi-originating counterparts. This information, which is useful in driving improvements in the overall defect density, has led to Hitachi Cable scanning all of its SiC substrates before growth to screen out low-quality wafers that are not suitable for production.
Although the work at Hitachi Cable has shown that OSA images are suitable for troubleshooting engineering processes, automated defect detection and classification is more valuable to a production environment. This latter function is also possible using an OSA, which can count and report defects in a standardized way, enabling comparison between wafers, runs and process tools.
AcknowledgmentsLaurie Bechtler would like to thank Steven Meeks, Vamsi Velidandla, Yohei Otoki, Takeshi Tanaka and Yoshiharu Koji.
Further reading
S Meeks 2000 Proc. SPIE 3966 p385.
Y Otoki et al. 2003 MANTECH Digest p331.

