Photoresist cuts strengthen Skyworks' gross margin
Nobody wants to waste 99% of the expensive materials that they use in high-volume production processes. But that is what happens when semiconductor manufacturers coat their wafers with photoresists. During the spin-coating process a large proportion of the resist is flung off or lost through evaporation and less than one-hundredth of the original volume used forms a film on the wafer.

This wastage is highly undesirable because typical photoresists cost hundreds of dollars per liter and they are used for multiple spin-coating processes during device manufacture. Annual expenditure on these types of material can run into hundreds of thousands of dollars, so reducing their consumption can bring significant cost savings.
At Skyworks Solutions Newbury Park GaAs wafer fab in California, we have tried to do this by running a Six Sigma project to cut our photoresist bill. This effort focused on reducing the cost and waste of our photoresist coating step without impacting our products or downstream processes. We restricted our study to the two highest-volume resists, which saved time but allowed the project to make a big impact. That s because these two solutions account for 80% of all of our resist costs and more than 2% of our total wafer-manufacturing costs.

The photoresists are applied to the wafer during photolithography processes using a dedicated tool with a nozzle. Before we started the project we routinely used 2.1 ml/wafer of photoresist. We decided to reduce this resist dispense volume in two phases. Initially we cut our photoresist to 1.5 ml to make cost savings. Then we evaluated further reductions.

The Six Sigma approach
Every Six Sigma project begins with the writing of a project charter. In our case, this document set out the project s objective, scope and schedule, with the business case, constraints, assumptions and estimated cost savings. Internal customers from the wet etch, dry etch and photolithography process groups were invited to join our team, which allowed us to listen to their concerns and incorporate their needs into the process. This team identified the common variables that could affect the resist coat process in a fishbone diagram (figure 1). Once the management had approved the project s definition and outline in a tollgate review, we moved on to the measure stage.
This part of the project focused on compiling baseline data for future comparisons, which were gathered from daily resist thickness and cross-section measurements for both standard and image-reverse resist processes. The data s units, equipment settings and step-by-step measurement methodologies were reviewed by our team and the relevant operators. The fishbone diagram created in the first stage of the project was used to identify the variables that were expected to have the largest impact on resist uniformity control.

We also carried out an informal survey at CS Mantech 2006 to see how our resist dispense volume compared with that of five other GaAs manufacturers (figure 2). These results highlighted the large differences in the photoresist volumes used and indicated that it might be possible to reduce the resist dispense to 0.7 ml per wafer.

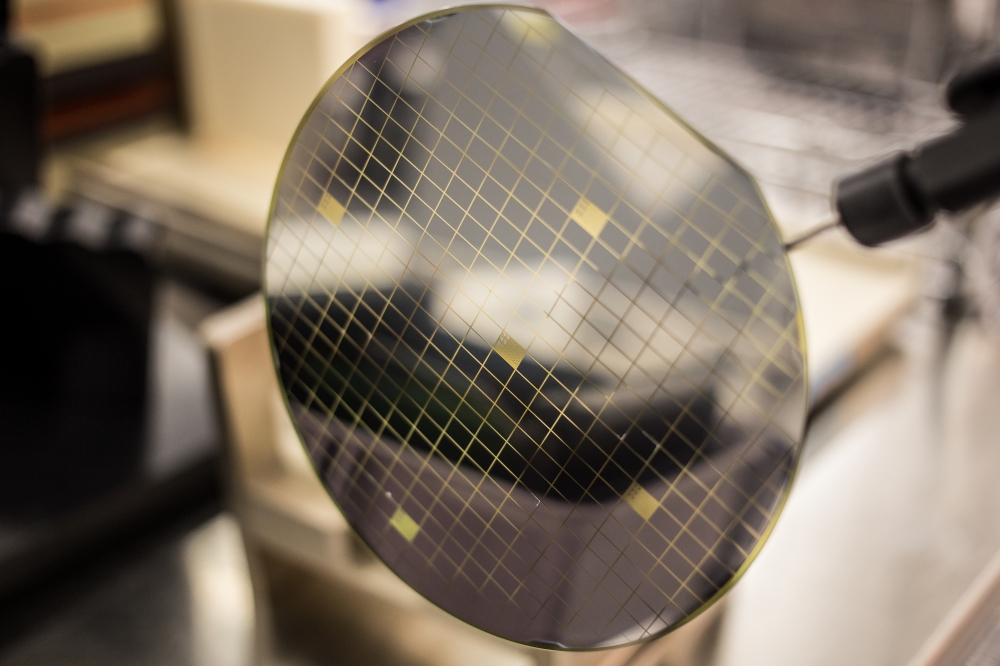
We constrained our investigations to resist thicknesses of between 1.25 and 3.0 µm. To find the dispense volume lower limit for this range, we coated 25 wafers with various dispense volumes, which varied from the 2.1 ml/wafer used historically, to just 0.5 ml/wafer (figures 3 and 4). Analysis revealed that a dispense volume of 0.7 ml gives acceptable and repeatable resist uniformity. Cross-sectional images of transistors coated with this amount of material revealed a 1.25 µm thick resist with a coverage quality comparable to all other resist dispense volumes. A 0.5 ml dispense volume can still produce good resist coverage, but this film does not always coat all of the wafers completely.

The 0.7 ml dispense volume produced a coating that is stable over short periods of time. However, any equipment or process drift towards smaller dispense volumes could jeopardize this stability, so we selected 1.0 ml/wafer as our target for resist reduction. After completing a successful tollgate review for this section of the project, we went on to analyze which process variables could be adjusted to produce the largest gains for meeting our overall goals.
For the analyze stage we carried out further experiments at a variety of resist dispense volumes and determined the impact that these changes had on our critical process characteristics. Measurements of the developed resist s profile, linewidth cross-section and electrical characteristics were made. If any particular set of process conditions produced values inferior to those associated with the standard process, then those conditions were discarded.
We also analyzed the resist temperature, dispense nozzle position and whether the wafer was spinning as the photoresist was dispensed, to judge their effects on resist thickness uniformity. Statistical t-tests revealed that thickness uniformity was not affected by temperature or nozzle position, while dispensing the photoresist on a spinning wafer brought slight improvements over the static equivalent. Meanwhile, images of the standard and lift-off resist profiles revealed that the resist s coverage quality was not diminished by wafers with a more rugged topography. These and other results indicated that it made sense to test a 1.0 ml/wafer dispense volume in mainstream production.
In the fourth stage, we used photoresist films with a 1.0 ml dispense volume on a limited number of production wafers. We processed three production lots, treating half of the wafers with 1.0 ml dispense volumes and the other half with the standard 1.5 ml. For each of these lots, the critical dimensions of the wafer were measured at each coat-processing step using a scanning electron microscope.
No statistical difference was found between the thickness of the majority of process layers produced by both methods and any differences were within the measurement error of the imaging tool. Most of the electrical data from the wafers with the lower dispense volume told a similar story. In the cases where differences did occur, these were within the fluctuations associated with the standard process, according to historical production lot data.
Although our new process gave the same results as our existing one, we could not ignore our customer s concerns. So we asked them to help us to complete a failure mode and effects analysis (FMEA) study – a systematic review of potential process failures that can determine possible causes for each failure. For each cause, the team suggested some controls that could prevent failure.
This team also identified causes of failure that occur frequently or have a small chance of detection or prevention, and defined and implemented actions that address each of these concerns. The process-control plan was also updated to ensure that equipment and process controls were in place for each critical process-control characteristic. Finally, we released the process change on one of our coater tracks as part of a pilot production ramp.
We then entered the control phase, which required a review of the first month s production data. No process shifts were observed and we confidently released the process on our remaining coat tracks. One month s data from all of these tracks and electrical test data revealed no process shift.
These results left one hurdle to full production release – verification that out-of-control action plans were in place for all known process failures. These would direct production technicians to the appropriate response procedure, should the process fail. Action plans were put in place by storing the project data in a central repository, which was referenced by a storyboard that included links to all data, reports, actions taken and improvements made.
Our first year of production with the new process has validated the success of the Six Sigma project. After cutting the photoresist dispense volume from 2.1 to 1.0 ml/wafer, critical wafer dimensions have remained stable, our downstream process has not shifted and the reduced material consumption (confirmed independently by the Skyworks Environmental Department) has saved our company nearly $0.5 million. We have also had no complaints downstream or from external customers.