News Article
Quartz Sharpens SEM Images
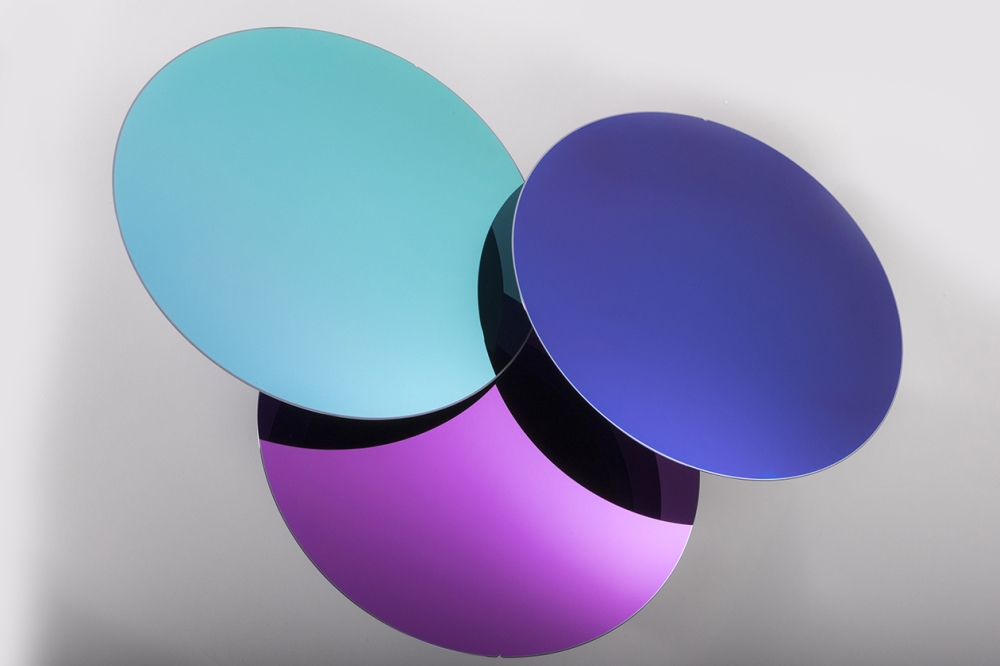
A new feature of Quartz PCI software, works with a single image or a group of images of III-V semiconductors
Quartz Imaging Corporation is introducing a new SEM sharpness measurement tool.
Scanning Electron Microscopy (SEM) images can be measured regularly to monitor the performance of an SEM and a detailed report can be generated in just a few clicks. This is the latest feature of Quartz PCI.
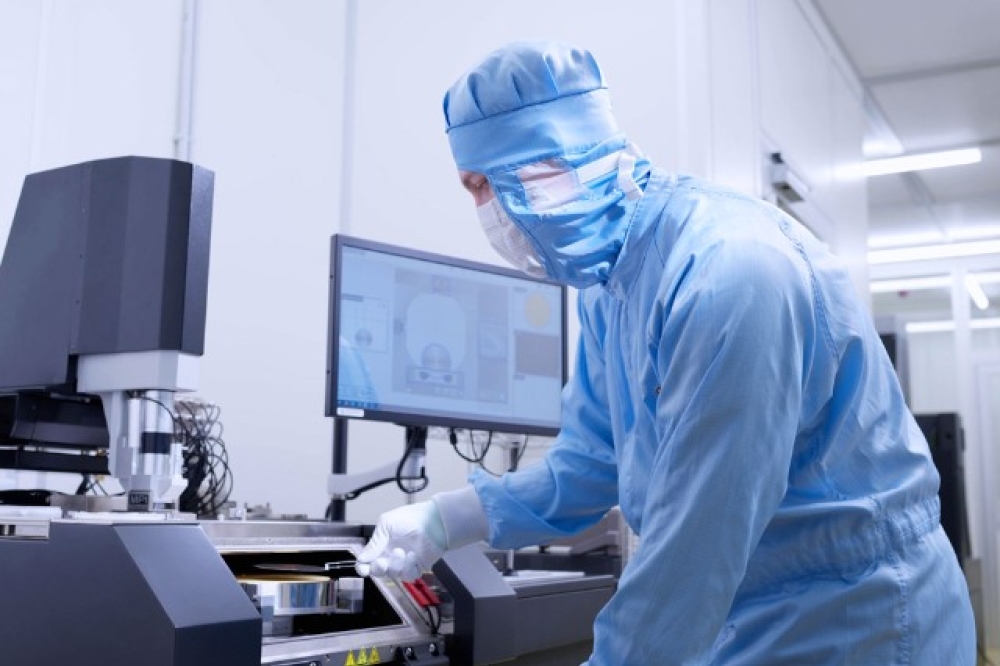
Even with Preventive Maintenance programs provided by SEM manufacturers, it is still important for microscopy labs and their clients that the performance of SEMs and the quality of the images they create be monitored regularly. Image sharpness, which is related to resolution, is the primary indicator of SEM performance.
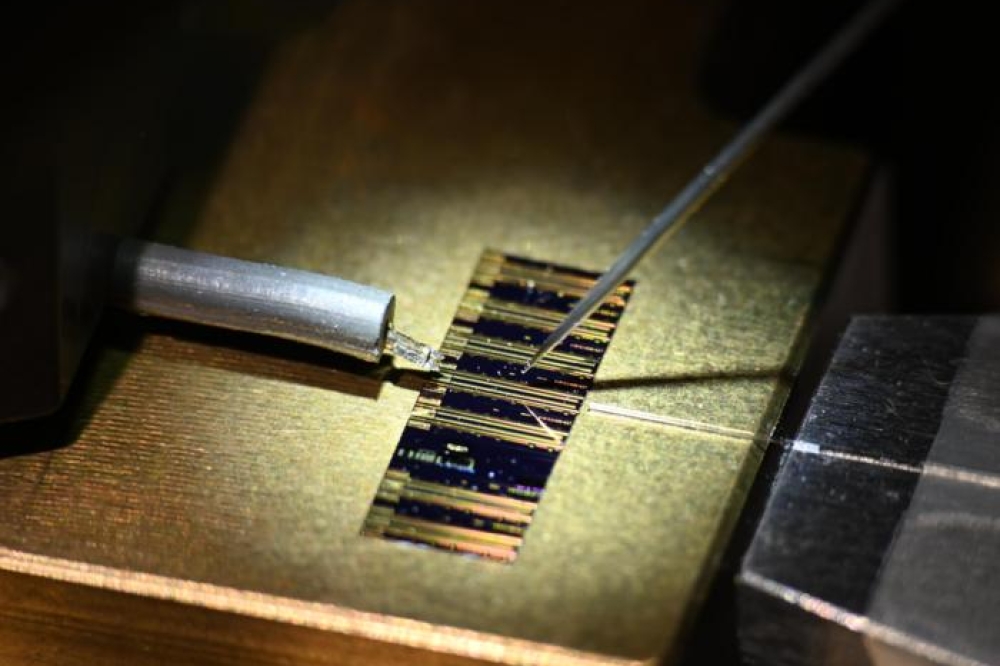
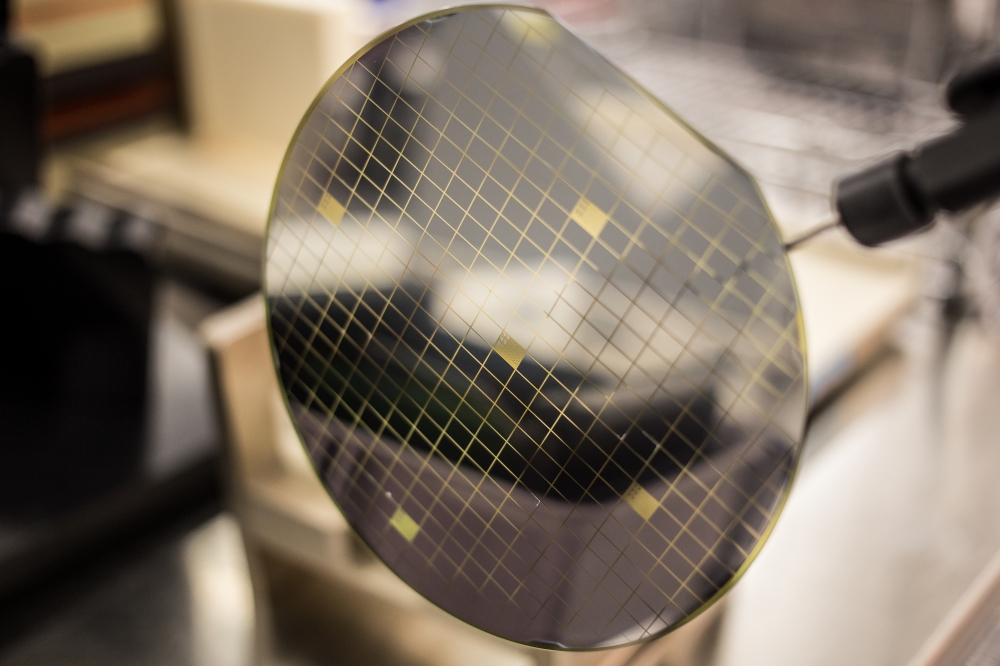
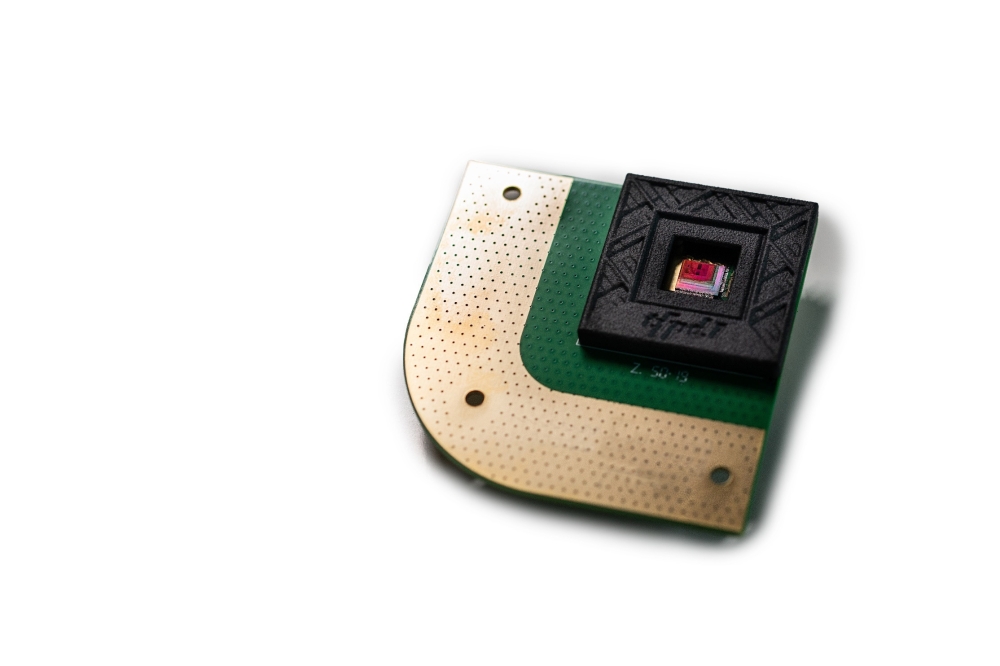
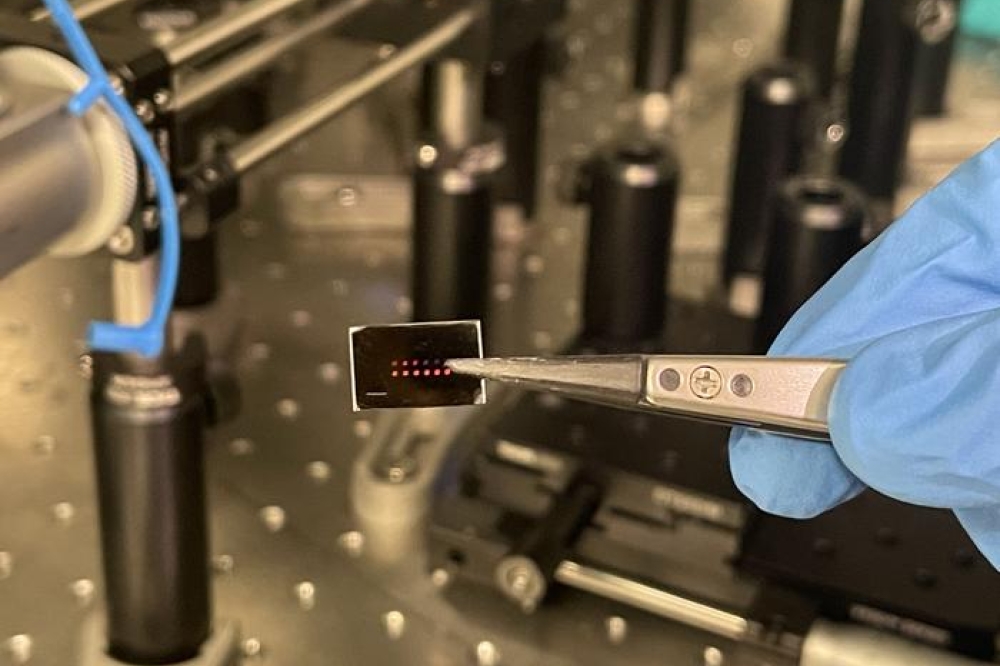
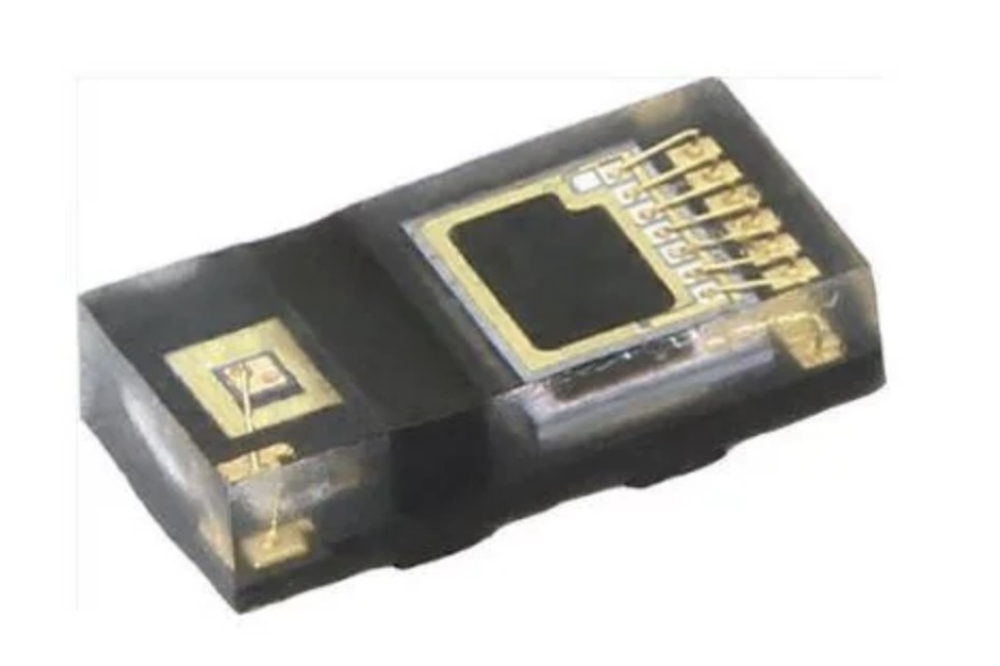
SEM is an invaluable tool in looking at interfaces in III-V semiconductors and it is far less laborious to make SEM samples than make ones for TEM. Transmission Electron Microscopy (TEM) has major advantages over SEM, but if time is of the essence, then SEM is a major asset. Especially as a wide area can be viewed in one sample, unlike in TEM.
Quartz Imaging has recently introduced its SEM Sharpness Measurement Tool, included in Quartz PCI version 9. With this tool, microscopists will be able to quickly and easily measure and monitor the performance of their SEM.
Regular sharpness (resolution) measurements can identify when an SEM is in need of service, before the performance becomes an issue. The SEM Sharpness Measurement Tool uses the FT (Fourier Transform) and DR (Derivative Method) methods to calculate the sharpness of an image. Both methods conform to the ISO standard “ISO/TS 245697 – Methods of evaluating image sharpness”.
In a matter of moments, the SEM Sharpness Measurement Tool calculates CNR (Contrast-to-noise ratio) along with FT and DR sharpness results to create an average score for each image and an overall score for the SEM.
Operators also have the option of dropping the best and worst average results when calculating the overall performance of the SEM utilising multiple images. A polar plot showing the sharpness value vs. angle can also be generated increasing the information available related to the resolution performance of the SEM. As with all PCI software a report can be easily generated including all images, their sharpness measurement results and polar plots.
Scanning Electron Microscopy (SEM) images can be measured regularly to monitor the performance of an SEM and a detailed report can be generated in just a few clicks. This is the latest feature of Quartz PCI.
Even with Preventive Maintenance programs provided by SEM manufacturers, it is still important for microscopy labs and their clients that the performance of SEMs and the quality of the images they create be monitored regularly. Image sharpness, which is related to resolution, is the primary indicator of SEM performance.
SEM is an invaluable tool in looking at interfaces in III-V semiconductors and it is far less laborious to make SEM samples than make ones for TEM. Transmission Electron Microscopy (TEM) has major advantages over SEM, but if time is of the essence, then SEM is a major asset. Especially as a wide area can be viewed in one sample, unlike in TEM.
Quartz Imaging has recently introduced its SEM Sharpness Measurement Tool, included in Quartz PCI version 9. With this tool, microscopists will be able to quickly and easily measure and monitor the performance of their SEM.
Regular sharpness (resolution) measurements can identify when an SEM is in need of service, before the performance becomes an issue. The SEM Sharpness Measurement Tool uses the FT (Fourier Transform) and DR (Derivative Method) methods to calculate the sharpness of an image. Both methods conform to the ISO standard “ISO/TS 245697 – Methods of evaluating image sharpness”.
In a matter of moments, the SEM Sharpness Measurement Tool calculates CNR (Contrast-to-noise ratio) along with FT and DR sharpness results to create an average score for each image and an overall score for the SEM.
Operators also have the option of dropping the best and worst average results when calculating the overall performance of the SEM utilising multiple images. A polar plot showing the sharpness value vs. angle can also be generated increasing the information available related to the resolution performance of the SEM. As with all PCI software a report can be easily generated including all images, their sharpness measurement results and polar plots.