Technical Insight
Maverick manufacturing anomalies: What threat to reliability?
Even veterans of reliability measurements struggle to provide customers with predictions of the future reliability of a lot that exhibits early fallout in the factory. That’s because, until recently, it’s been very difficult to gather the data needed to respond with a specific and satisfying answer, says Bill Roesch from TriQuint Semiconductor.
When you work in manufacturing, you strive for perfection. It may seem like a lofty goal, but it’s one that is possible to achieve – at least for most customers, most of the time. However, occasionally it is inevitable that semiconductor failures happen, and it’s how you deal with them that matters.
If methods for scrutinizing products passing through the manufacturing line are well chosen, revealing and reliable, it is possible to rout out the vast majority of imperfect parts. But occasionally an anomaly will slip through, ending up inside consumer goods. And when one of these components starts to malfunction, the customer comes calling with a list of really tough questions.
Among the most difficult to answer is this one: What is the risk that we have only seen the tip of the iceberg? This particular question crops up because it helps the customer to get a feel for the answers to several more that are giving them sleepless nights: How many more problems will I see from this batch? Should I stop production and/or shipments of this material? And should I recall previous material that has already shipped?
Customers are also really anxious to know that the root cause has been diagnosed with complete certainty, and there is absolutely no chance that it will happen again. And afterwards, when the dust has settled and they have had a chance to ponder some more, they will eventually ask a broader question that’s along these lines: What is the risk that I’ll get more problems?
At TriQuint Semiconductor, like every big chipmaker, we have had to deal with these types of questions from customers. When it happens, we carry out our investigation in a thoughtful manner, using in-depth knowledge of our processes, combined with structured problem solving, to determine the issue. Once we’ve done that, we contain the situation, hunt down the root cause, verify the solution, implement corrective action, and prevent it from happening ever again. But the question of assessing reliability risk of material that’s already in the customer’s hands isn’t a natural outcome of the corrective action process.
Our quest to measure this risk came to fruition at the end of 2010, when a single part was returned from a customer. We submitted this part for failure analysis and uncovered a rare defect. It was a déjà-vu moment, because we had first discovered this type of defect some 12 years earlier (we’ll get back to that later). This time, however, we were able to finish the story, thanks to some good fortune on our side: The customer’s fallout had happened to coincide with a manufacturing lot that had been split during module assembly and packaging, prior to final test. This split meant that the customer got half of the material, but there were still over 30,000 virgin parts on our site, which enabled us to provide a definitive answer to the customer’s toughest question of all: What’s is my reliability risk?
The situation that we were in is very rare. Normally, by the time an anomalous device is returned to the supplier and analyzed down to the true root cause, the customer has consumed all of the batches in question. That makes it incredibly challenging for the supplier to assess reliability risks, because they don’t have examples on hand that feature the anomaly. So when a customer asks: “What is my reliability risk?” the supplier’s best answer is “What fallout have you seen so far?”
Digging deeper
If you dig into this awkward situation, you’ll realise that we have uncovered a true maverick lot. In other words, this is a batch of material that had no anomalies detected by the supplier, yet the lot eventually produced some fallout in the customer’s hands. At this point, all the information on the severity of the problem is coming from the customer. This means that unless the supplier can somehow recover a statistically significant sample of the batch that’s in question, there isn’t any more that can be learned outside of the customer’s experience. When this happens the customer is far from happy: When they ask questions to the chipmaker, the response they get is not an answer, but even more questions.
Let’s return to our particularly fortunate situation where samples were on hand to assess risk. In this scenario, the task is different from typical reliability success testing, which is used to qualify devices. And the goal is very different too. The focus not on longer capability testing, which is designed to wear out the entire population and measure degradation along the way – instead the hunt his on for defects, which are ideally found in a way that emulates the stress in the lifecycle of a typical consumer device. In our case we decided to age the parts and measure the resulting fallout, because this allowed us to determine the risk in timeframes that are useful for the customer.
Our second slice of luck was that we could detect the particular defect and isolate it from all other forms of degradation with an external electrical measurement, which was performed with production test equipment. We aimed to complete final component testing, closely approximate customer-applied stress, and then accelerate parts through their useful life span using environmental stressing techniques, introduced as aggressively as possible.
Figure 1. Expected reliability fallout for normal lots.
The primary goal was to induce all maverick fallout – without wearing-out the samples – and tally the risk at every stage in the OEM and consumer lifetimes of the devices. Since we had some experience with the failure mechanism, we were able to confidently select a group of reliability stresses with the best chance of inducing trauma that would simulate a customer’s lifetime of use (see table 1 for details).
We selected these stages based on the time frames that customers’ outline when describing their curiosity about reliability risks. Overarching these stages is a built-in expectation of defects for ‘normal’ (non-maverick) batches. The inherent expectation encompasses the relationships of quality assessments, made during manufacturing, and the reliability found in the consumer’s hands (see figure 1 for details). These expectations are built upon decades of experiences where quality is predictive of reliability.
The normal situation is great, with reliability risk reducing at every stage in the life of an integrated circuit. What’s more, often the natural decreasing risk is even better than what we’ve portrayed here as ‘normal’, which is actually closer to defining the ‘boundary’ between acceptable and anomalous.
Figure 2. Measured fallout risk for special lot, 0.5 percent total affected parts.
Scrutinizing lots
With our plan, our expectation, and 30,000 samples in hand, we set out on a Friday morning to measure the risk of this special lot of material. By Monday, 150,000 measurements later, we had all the data we needed to precisely answer the tough question for this special lot. On top of that, we had identified a more general relationship, which would come to our aid when answering future questions about this type of scenario.
Even though we gathered most of the data in just one weekend, the results are compelling. That’s partly because we had such a massive sample to work with, and partly because our findings were matching the customer’s experience (so far) with their suspect population of devices.
Armed with all this information, we could now provide a definitive answer to the specific question about risk. Our data enabled us to know what fallout to expect at each stage, plus the relative ratio of fallout to expect for this particular failure mechanism. The relative measure is highly valuable, because we can use the known ratio to make predictions, should other batches be found with different defect concentrations.
We found that it was very difficult to evoke the anomaly during manufacture with our normal suite of module tests. On the other hand, the OEM had the best detection, since their solder reflow process was 20 times better at exacerbating the fallout.
The good news was that the fallout in the life stages following reflow was always lower than what the customer would see within their factory. So, in general terms, we could inform our customer that the worst fallout would occur in their factory, and the warranty risk to their customer was about half of the initial factory fallout and would be decreasing throughout the rest of the product’s life [1].
We continued to torture the samples with more aging and with multiple stress sequences to squeeze out every last drop of information. So within a few days of the initial weekend results, and after another 175,000 more measurements, the fallout eventually dropped to zero and this gave us the final total of affected parts in our special lot… one half of one percent.
Table 1. Plan for evaluating reliability of lifetime stages.
Table 2. Risk assessment results.
Wider implications
To answer the broader questions customers can pose about detection and prevention of maverick lots, we must rewind the clock right back to 1998, when we first saw this mechanism returned from a customer [2]. At that time, we only had the customer’s returns to work with, so we studied the mechanism very hard. However, we could never re-create the root cause.
What we did do was take preventive action, involving process improvements and design changes. In addition, we developed special test structures to detect the recurrence of this elusive defect. Twelve years on, the structures proved themselves worthy when we discovered a hike in the resistance on special monitors in several wafer lots – the old problem had come back!
In the initial re-discovery, we saw less than one-third of the wafers affected from three lots. The data indicated that the defect-creating malfunction was intermittent by lot and variable across each wafer within each affected lot. But this initial signal was still enough for us to check for a process commonality and implicate a single process tool as the cause.
In spite of the early detection success of our special structures, the shear volume of production had already carried many lots through the offending tool during the few hours it took to complete the failure analysis. We tried to contain the defective parts by shutting down that tool and gathering up all the material that had gone through it. As a precaution, all of the material through the offending tool was scrapped regardless of the product design or its susceptibility to the malfunction.
Eventually other built-in indicators picked up traces of the malfunction, and more material was brought into containment. As a precaution, we even extended our quarantine to earlier lots, where we were unable to detect any other signals. In effect, by extending the containment earlier and earlier, we provided a time buffer between our customers and the suspect material produced by the malfunctioning tool.
In addition to separating suspect devices from our customers, all of this work enabled us to confirm the root cause and verify the corrective action. We utilized additional special test wafers, armed with our most sensitive reliability measurement structures, to verify that we had completely fixed our tool. But in spite of all these precautions, it turned out that the one single customer return, which sparked the risk investigation described in this story, was built on the suspect fab tool just a few days before our time-buffered quarantine!
So what are the lessons that we can learn from all of this? Defects can reappear after a decade or more, so good record keeping, well-designed test structures and engineers with lots of experience and good memories are invaluable; but to get to the cause of the problem, having some luck on your side can really help. We did, and by scrutinizing 30,000 virgin parts we were able to tell our customer that the chances that these parts were failing were going to get less and less. It was great to give them a reassuring answer to that most vexing of questions: What is the reliability risk?
Anatomy of an Anomaly
Eventually, fab tools wear out. This happens in every fab, including those at TriQuint, where a tiny leak inside the oldest metal deposition system caused the defect that is behind the story described in this feature. This leak occurred only when wafers were transfer by a robotic system from one deposition chamber to another. There are steps in place to prevent leaks, with all the chambers inside the system maintained under vacuum and the gas content monitored all around during the processing steps. However, in this particular case, door movement led to a brief gap to atmosphere. This allowed a puff of oxygen to sometimes find its way to a warm, freshly deposited metal layer before rapidly dissipating into the vacuum.
The pattern of discovery provided a tell-tale sign an intermittent, miniscule leak. When the door leaked, it introduced imperfections to the edge of the wafer nearest the door. But when the door operated in the manner it was designed to, the wafer was unaffected.
One of the potential impacts of the anomalous oxidation of metal is degradation in the adhesion between layers, which results in an increase of resistance between the upper metal interconnects. TriQuint’s fabrication process included ten different escape points, which all detected and contained this type of defect. However, not all the defects were detectable. Combined with physical stresses within the packaged, finished circuit, and with external stress applied by the manufacturing assembly environment, the variation in interconnect resistance could sometimes result in a device malfunction only in the customer’s hands.
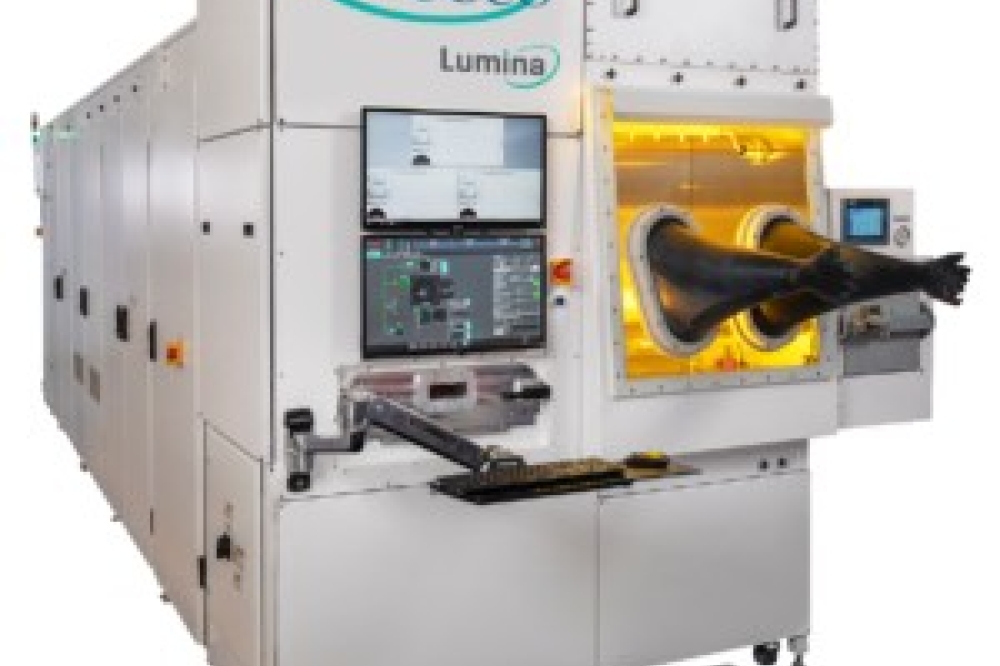
Multi-chamber cluster tool used to deposit several metal layers.
References:
[1] Assessing the Reliability Risk of a Maverick Manufacturing Anomaly,
William J. Roesch, International Conference on Compound Semiconductor Manufacturing Technology, April 25, 2012, Boston Massachusetts, pp. 83-86
[2] Thermal Excursion Accelerating Factors, William J. Roesch, GaAs REL Workshop, October 17,1999, Monterey California, pp. 119-126

